Graphviz Layout: Node Spacing, Rank Spacing, Direction, and Edge Routing
This article is for people who are already familiar with Graphviz and want more control over the layout of a DOT diagram.
With the dot engine, set nodesep for the minimum space between nodes on the same rank and ranksep for the minimum space between ranks. rankdir=TB puts successive ranks below each other; rankdir=LR puts them to the right. These are layout requests, not fixed center-to-center distances.
Below are a few layout options for a small service diagram. For a focused example of putting nodes on the same rank, see how to align Graphviz nodes.
That would be our starting point, let's say we are creating a simple system architecture diagram.
digraph Graph {
  node[shape=rect]
  gateway -> users
  gateway -> companies
  gateway -> groups
}

specify Width and Heigh of nodes
explicitly set width and height of nodes
digraph Graph {
  node[shape=rect]
  gateway[width=3 height=0.3]
  gateway -> users
  gateway -> companies
  gateway -> groups
}
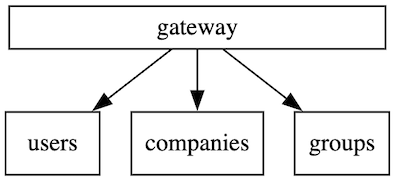
splines - change how edges are routed
The graph-level splines attribute controls how dot draws edges. To compare the options, here is one graph with an extra users -> groups edge, so some edges have to route around other nodes:
digraph Services {
  node [shape=rect];
  gateway [width=3 height=0.3];
  gateway -> users;
  gateway -> companies;
  gateway -> groups;
  users -> groups;
}
Each variant below changes only the splines=... line. All renders come from the site's Graphviz renderer (Graphviz 9.0.0 via @viz-js/viz).
Default (splines=spline, same as true): smooth curves that route around nodes.

Open the default spline layout in the playground
splines=curved: curved edges, but they are not routed around nodes. In this render, the gateway-to-groups edge passes through the companies box.

Open the curved layout in the playground
splines=polyline: straight segments that bend to stay clear of nodes. This option is useful when you want straight edges without overlaps.

Open the polyline layout in the playground
splines=ortho: only horizontal and vertical segments. Here, the edges from gateway and users both enter groups on its left side.

Open the orthogonal layout in the playground
splines=line (same as false): straight lines from node to node that ignore other nodes. The gateway-to-groups edge cuts straight through companies.

Open the line layout in the playground
Orthogonal edges: labels and ports
splines=ortho is often used for architecture diagrams, but in the site's renderer it has two limitations.
Edge labels. A label on an orthogonal edge makes Graphviz warn: "Orthogonal edges do not currently handle edge labels. Try using xlabels." The diagram still renders, but the label is placed without regard to the route. Switching to xlabel removes the warning, but as the second edge shows, it still overlaps the line in this render:
digraph Labels {
  splines=ortho;
  node [shape=rect];
  api -> db [label="reads"];
  api -> cache [xlabel="reads"];
}

Open the orthogonal label example in the playground
If edge labels matter, prefer the default spline or polyline. They don't trigger the warning, and dot includes their labels in the layout. Labels can still crowd neighboring edges in a tight graph, though. In this two-edge example, removing splines=ortho and adding nodesep=0.8 moved both labels off their lines.
Ports. ortho ignored the tail port in this test. The edge asks to leave the bottom of api (tailport=s), but the orthogonal edge starts at the center of api, runs through its text, and leaves to the right:
digraph Ports {
  rankdir=LR;
  splines=ortho;
  node [shape=rect];
  api -> db [tailport=s headport=n];
}

Open the orthogonal port example in the playground
Remove the splines=ortho line and the same edge leaves from the bottom of api as requested:

Open the spline port example in the playground
For more on ports, see how to connect Graphviz edges to node ports. See the Graphviz splines reference for all accepted values.
Compare node and rank spacing with the same graph
In dot, both nodesep and ranksep are specified in inches. Defaults are nodesep=0.25 and ranksep=0.5. nodesep is the minimum gap between neighbors on one rank; ranksep is the minimum gap between ranks. Labels and other layout constraints can make the actual gaps larger.
Start with top-to-bottom (TB) flow, leaving both spacing values at their defaults:
digraph Service {
  graph [rankdir=TB];
  node [shape=box];
  request -> api;
  request -> worker;
  api -> store;
  worker -> store;
}
Open the default TB diagram in the playground

Now keep every node and edge but set nodesep=0.85 and ranksep=1.2:
digraph Service {
  graph [rankdir=TB, nodesep=0.85, ranksep=1.2];
  node [shape=box];
  request -> api;
  request -> worker;
  api -> store;
  worker -> store;
}
Open the spaced TB diagram in the playground

In this four-node render, the API-to-Worker center distance grows from 73 to 116 points, and the Request-to-API rank distance grows from 72 to 122 points. Those measured distances describe this diagram, not a conversion rule from the attribute values: node sizes and routing affect the final geometry.
Rotate the same spaced graph from TB to LR
Change only rankdir to LR:
digraph Service {
  graph [rankdir=LR, nodesep=0.85, ranksep=1.2];
  node [shape=box];
  request -> api;
  request -> worker;
  api -> store;
  worker -> store;
}
Open the spaced LR diagram in the playground

With TB, ranksep separates rows vertically and nodesep separates nodes across each row. With LR, ranksep separates columns horizontally and nodesep separates nodes vertically within a column. This comparison uses the site's Graphviz dot renderer; other engines such as neato do not follow the same rank rules. See the Graphviz nodesep and ranksep references for the full attribute behavior.
Now let's say I add one more edge, and it changes the weights of nodes and makes graph looks like that
digraph Graph {
  node[shape=rect]
  splines=ortho
  gateway[width=3 height=0.3]
  gateway -> users
  users -> companies
  gateway -> companies
  gateway -> groups
  nodesep=1
}
 there are 2 ways to address that
apply rank to subgraph items
you can apply same 'rank' to a subgraph
digraph Graph {
  node[shape=rect]
  splines=ortho
  gateway[width=3 height=0.3]
  gateway -> users
  users -> companies
  gateway -> companies
  gateway -> groups
  nodesep=1
  {
    rank=same
    users
    companies
  }
}
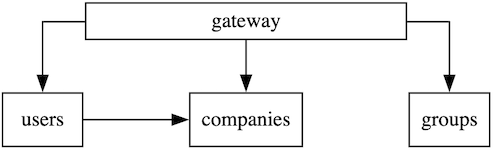
constraint
if you see that some arrow adds to much weight to a node, you can exclude it from ranking
digraph Graph {
  node[shape=rect]
  splines=ortho
  gateway[width=3 height=0.3]
  gateway -> users
  users -> companies[constraint=false]
  gateway -> companies
  gateway -> groups
  nodesep=1
}
Please checkout some of our useful resources:
- Graphviz cheatsheet
- Graphviz Playground
- Graphviz interactive tutorial
- Graphviz vs MermaidJS comparison
- Align Graphviz nodes on the same rank
This article was originally published in DevToolsDaily blog